Filter results
Category
- (-) Energy Resiliency (7)
- (-) Visual Analytics (6)
- Scientific Discovery (178)
- Biology (106)
- Earth System Science (89)
- Human Health (69)
- Integrative Omics (52)
- Microbiome Science (16)
- National Security (14)
- Computing & Analytics (10)
- Computational Research (6)
- Atmospheric Science (3)
- Coastal Science (3)
- Computational Mathematics & Statistics (3)
- Data Analytics & Machine Learning (3)
- Data Analytics & Machine Learning (3)
- Renewable Energy (3)
- Chemical & Biological Signatures Science (2)
- Cybersecurity (2)
- Distribution (2)
- Ecosystem Science (2)
- Electric Grid Modernization (2)
- Grid Cybersecurity (2)
- Weapons of Mass Effect (2)
- Bioenergy Technologies (1)
- Chemistry (1)
- Computational Mathematics & Statistics (1)
- Energy Efficiency (1)
- Energy Storage (1)
- Grid Analytics (1)
- High-Performance Computing (1)
- Plant Science (1)
- Solar Energy (1)
- Subsurface Science (1)
- Terrestrial Aquatics (1)
- Transportation (1)
- Wind Energy (1)
Content type
Dataset Type
Dataset The dataset will consist of: About 1200 news stories from the Alderwood Daily News plus a few other items collected by the previous investigators A few photos A few maps of Alderwood and vicinity (in bitmap image form) A few files with other mixed materials, e.g. a spreadsheet with voter...
Category
It is Fall of 2004 and one of your analyst colleagues has been called away from her current tasks to an emergency. The boss has given you the assignment of picking up her investigation and completing her task. She has been asked to pursue a line of investigation into some unexpected activities...
Category
The VAST 2010 Challenge consisted of three mini-challenges (MC) and one Grand Challenge (GC). Each MC had a data set, instructions and a number of questions to be answered. The GC required participants to pull together information from all three data sets and write a debrief summarizing the...
Category
This year’s VAST Challenge focuses on visual analytics applications for both large scale situation analysis and cyber security. We have two mini-challenges to test your analytical skills and confound your visual analytics applications. In the first mini-challenge, (the imaginary) BankWorld's largest...
Category
Mini Challenge 1: Wiki Editors The Paraiso movement is controversial and is having considerable social impact in a specific area of the world. We have extracted a segment of the Paraiso (the movement) Wikipedia edits page. Please note this is not the Paraiso Manifesto Wiki page which is part of the...
Category
The VAST 2009 Challenge scenario concerned a fictitious, cyber security event. An employee leaked important information from an embassy to a criminal organization. Participants were asked to discover the identity ofthe employee and the structure of the criminal organization. Participants were...
Category
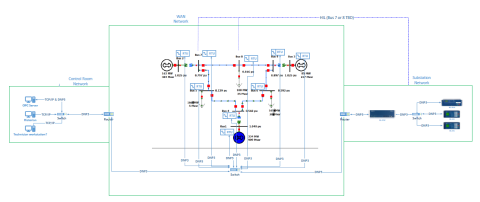
This dataset includes one baseline and three cybersecurity based scenarios utilizing the IEEE 9 Bus Model. This instantiation of the IEEE 9 model was built utilizing the OpalRT Simulator ePhasorsim module, with Bus 7 represented by hardware in the loop (HiL). The HiL was represented by two SEL351s...
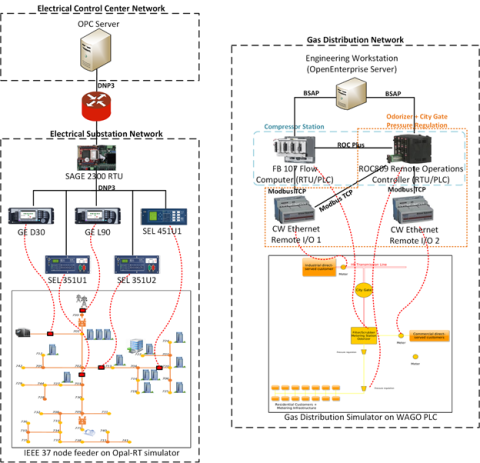
This dataset includes the results of high-fidelity, hardware in the loop experimentation on simulated models of representative electric and natural gas distribution systems with real cyber attack test cases. Such datasets are extremely important not only in understanding the system behavior during...
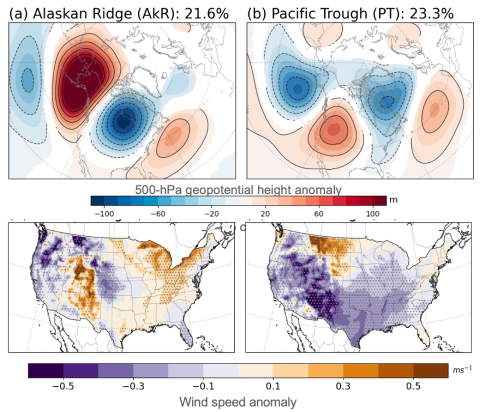
Supporting data and code uploaded to DataHub for "How do the weather regimes drive wind speed and power production at the sub-seasonal to seasonal timescales over the CONUS?" Created by Ye Liu*, Sha Feng*, Yun Qian, Berg K Larry, Huilin Huang *POC: Ye Liu, Ye.Liu@pnnl.gov Sha Feng, sfeng@pnnl.gov --...
Category
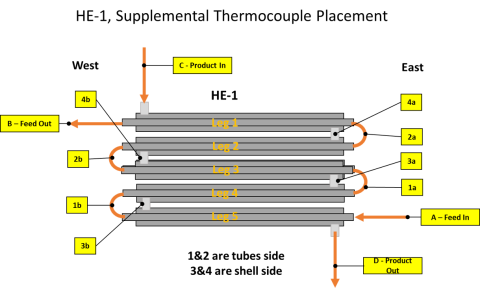
The presentation and supporting information provide data on the performance of an engineering-scale cross-flow heat exchanger used in hydrothermal liquefaction (HTL). Temperature profiles are provide for the process of waste water treatment sludges and a food waste. The data can be used to model...
Category
As energy prices rise and climate change brings more extreme and frequent days of heating and cooling, households must allocate more of their income to energy bills, increasing their energy burden. Many strategies are employed to alleviate high energy burden, such as weatherization, energy...
Category
Federal and state decarbonization goals have led to numerous financial incentives and policies designed to increase access and adoption of renewable energy systems. In combination with the declining cost of both solar photovoltaic and battery energy storage systems and rising electric utility rates...
