Description
Wan H., C.D. Burleyson, and N. Voisin. 2025. "Heat wave and cold snap event library under various technical choices for NERC subregions in the conterminous U.S. (1980 - 2024)." PNNL-SA-217022. Citation will be updated once the associated manuscript is accepted.
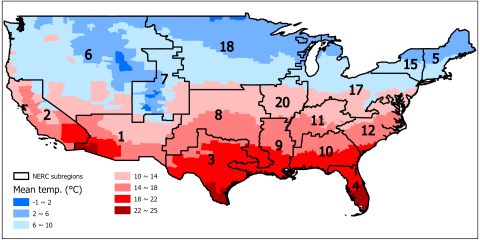
This Extreme Thermal Event Library provides comprehensive records of heat wave and cold snap events from 1980 to 2024, aggregated at the North American Electric Reliability Corporation (NERC) subregion level for the conterminous United States. A map of NERC subregions with county-level mean temperatures is included in the file 'NERC_subregions_with_mean_temperature.tif'.
The heat wave and cold snap events were identified using temperature data simulated by the Thermodynamic Global Warming (TGW) model. The raw TGW hourly temperature data (at a 12-km resolution) was aggregated to the county level using spatial averaging within county boundaries. Daily mean, maximum, and minimum temperatures were then derived from the hourly surface air temperature data for each county. Subsequently, the county-level daily temperatures were spatially aggregated to the NERC subregion level using three distinct spatial aggregation methods:
- Simple Mean (SM): A simple average of county-level temperatures.
- Area-Weighted Mean (MWA): Weighted by the area of each county.
- Population-Weighted Mean (MWP): Weighted by the population of each county.
The database includes separate zipped files for each spatial aggregation method:
- "heat_wave_library_NERC_average.zip" and "cold_snap_library_NERC_average.zip" contain events based on the SM method.
- "heat_wave_library_NERC_average_area.zip" and "cold_snap_library_NERC_average_area.zip" contain events based on the MWA method.
- "heat_wave_library_NERC_average_pop.zip" and "cold_snap_library_NERC_average_pop.zip" contain events based on the MWP method.
Each zipped file includes 12 event libraries, corresponding to 12 different event definitions. Details about these definitions are provided in the file 'Event definitions.docx'.
Event Library Structure
Each row in an event library represents one detected thermal event. The columns in the library are defined as follows:
- start_date: Start date of the event.
- end_date: End date of the event.
- centroid_date: The centroid date, calculated as the midpoint between the start and end dates.
- highest_temperature / lowest_temperature: The highest daily maximum temperature (for heat waves) or lowest daily minimum temperature (for cold snaps), in Kelvin.
- duration: Duration of the event in days.
- NERC_ID: Identifier for the NERC subregion.
- spatial_coverage: The spatial coverage of the event within the NERC subregion, expressed as the percentage of counties experiencing the event relative to the total number of counties in the subregion.