Description
The current data upload contains the following SPI drought analysis data over CONUS:
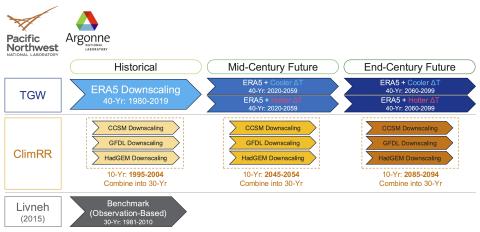
- Climate Forcing: ClimRR (CCSM) (https://climrr.anl.gov/climrrdata)
- Simulation Scenario: Historical
- Analysis Period: 1995-2004
- Drought Type: Meteorological (Precipitation) Drought (3-Month SPI)
- Output Format: NetCDF and CSV
- Spatial Resolution: 1/16th Degree for NetCDF and HUC4 for CSV
- Temporal Resolution: Monthly
- SPI3_g_ccsm_bc_hist_precip_1995-2004.nc provides gridded 3-Month SPI maps over CONUS.
- SPI3_g_ccsm_bc_hist_precip_1995-2004_HUC4_median.csv provides 3-Month SPI (median) for each HUC4.
- ROWs correspond to datetime stamps
- COLUMNs correspond to HUC4
- SPI3_g_ccsm_bc_hist_precip_1995-2004_HUC4_median_events_unstack.csv provides drought events (months) identified by applying the run theory for 3-Month SPI (median) for each HUC4.
- huc4: four digit Hydrologic Unit Code (HUC) - add a leading zero for three digit codes
- time: datetime stamp
- SPI: 3-Month Standardized Precipitation Index (SPI3; Gamma Fit)
- drought_id: identifier for drought events
- count: total number of drought events for each HUC4 over 1995-2004
- start: starting month of drought events
- end: ending month of drought events
- peak_t: peak (intensity) month of drought events
- severe_season: most severe season of drought events (accumulated)
- duration: duration of drought events
- severity: severity of drought events (accumulated intensity)
- intensity: intensity of drought events
- intensity_peak: peak intensity of drought events
English