Description
Overview
This dataset provides a consistent set of monthly hydropower generation for the US that reflects the local hydrologic cycle. The US Energy Information Administration (EIA) publishes monthly and annual generation data at most hydroelectric generation facilities as part of the EIA form 923. When monthly data is not reported, the agency uses a statistical method for disaggregating annual generation data to monthly. This approach does not represent the seasonal hydrologic cycle well enough for hydropower modeling or energy system studies. The RectifHyd dataset was developed to address this issue, it uses measurements of streamflow and reservoir outflows to disaggregate annual generation to monthly from 2001 through the end of 2024 for about 1500 plants in the US.
New in version v1.4.0
- The data has been updated through the end of 2024 (previously it only extended through 2022)
- The column names have been changed to all lower case
- The code has been cleaned up and better documented
- The data has been QA/QC’d and several bugs from the previous version have been fixed
- This release is hosted on PNNL’s DataHub but older versions will still be hosted on Zenodo
- The code for this version will be archived with the DataHub release but the repo will not be hosted publicly
See the History section below for the details about the older versions.
Direct data download
In R:
readr::read_csv("<update>") #or read.csv
In Python:
import pandas as pd pd.read_csv("<update>")
Using the data
The dataset is in tabular csv format with the following columns:
eia_id: Plant ID used by the Energy Information Administration. Note that some hydropower plants have multiple eia_ids for reporting purposes, eg. Hoover Dam.eha_ptid: Plant ID from ORNL Existing Hydropower Assets (EHA) database.plant: Plant name.state: State in which the plant is located (two letter abbreviation).date: Date of the first day of the month (YYYY-MM-DD format).year: Year of generation.month: Month of generation.monthi: Numeric month index (1-12).nameplate_mw: Nameplate capacity of the plant in megawatts.eia_fraction: Disaggregation fraction (a.k.a. proportion or weight) computed based on EIA data for annual to monthly disaggregation.eia_mwh: Monthly net energy estimate from EIA-923. A small number of these values are imputed for comparison purposes.eia_monthly_imputed: Flag indicating that a monthly data value was imputed and was originally missing from the EIA 923 data or determined to be erroneous during the QA/QC process. Imputation of monthly EIA generation values was introduced in version 1.3.eia_obs_freq: Denotes the observation frequency noted in EIA-923 data, “A”=Annual, “M”=Monthly, “NA”=Missing information, “AM” or “AM/A”=Mixed Annual and Monthly for different reported data.rectifhyd_fraction: Updated disaggregation fraction for annual to monthly generation.rectifhyd_mwh: “RectifHyd” monthly net energy estimate.rectifhyd_method: Denotes data used to disaggregate annual generation (e.g., total_plant_outflow, turbine_release, huc4_flow).smoothed: Flag indicating that a monthly disaggregation fractions for the year were smoothed during the QA/QC process. Smoothing is applied if any monthly generation exceeds the nameplate capacity of a plant or if it exceeds 25% of the annual generation.scaled: Flag indicating that a monthly disaggregation fractions were scaled during the QA/QC process. Scaling is applied only when smoothing is not sufficient to ensure nameplate capacity of a plant is not exceeded or if it exceeds 25% of the annual generation after smoothing. Scaling preserves the monthly generation shape but does not exceed nameplate capacity. Introduced in version 1.3.0.use_eia_monthly: Flag indicating whether to use the original EIA monthly data instead of RectifHyd in the case that reliable monthly generation data is available.recommended_data: The recommended data source to use, either “rectifhyd” or “eia” for specific plant/year.n_hours: Number of hours in the month.recommended_mwh: The recommended monthly generation value based on the recommended_data column.
Methodology
Disaggregation approach
The core idea behind RectifHyd is that annual EIA-923 generation totals are reliable, but the EIA’s statistical disaggregation to monthly resolution does not reflect the seasonal hydrologic cycle. By using observed streamflow or reservoir releases as a proxy for temporal generation patterns, we can produce monthly values that honor both the annual total and the local hydrology.
For each plant-year the disaggregation works as follows:
- Obtain a daily flow time series from the best available proxy (see priority below)
- Aggregate daily flow to monthly totals
- Compute monthly fractions:
fraction_m = monthly_flow_m / annual_flow - Apply fractions to the annual generation total:
gen_m = fraction_m * annual_gen
Flow proxy priority
Not all plants have the same quality of flow data available. The following sources are used in order of preference:
- Turbine release – Direct measurement of water passing through turbines at the dam, providing the best possible proxy for generation. Sourced from USGS NWIS, CDEC, RISE, NWD, CDSS, PNH, or MBH.
- Total plant outflow – Measurement of total outflow (turbine + spill) at the dam. Capped at the 90th percentile to reduce the influence of spill events. Sourced from USGS NWIS, ResOpsUS, NWD, or CDEC.
- Representative basin gauge – USGS stream gauge downstream of the dam or in the same basin, reflecting similar seasonal patterns. Identified manually via the
flow_to_EIA_crosswalk.csvmapping. - ResOpsUS reservoir release – Modeled/observed reservoir outflow from the ResOpsUS dataset. Linked via HILARRI’s mapping of EHA plant IDs to GRanD reservoir IDs. Note: ResOpsUS data largely ends in 2020; values are imputed beyond that date.
- HUC4 watershed flow – Monthly mean discharge from a representative USGS gauge for the 4-digit Hydrologic Unit Code (HUC4) containing the plant. This is the weakest proxy, as it assumes all plants in a watershed follow similar seasonal patterns.
QA/QC
Several quality control steps are applied after disaggregation:
- Smoothing: If any monthly generation exceeds 25% of the annual total or the plant’s nameplate capacity, loess smoothing is applied to the monthly fractions (up to 50 iterations)
- Scaling: If smoothing alone is insufficient, fractions are scaled down to enforce nameplate limits while preserving the overall seasonal shape
- Imputation: Missing monthly EIA values are imputed using
missRanger(random forest) across the gauge flow matrix to fill temporal gaps - Recommendation flag: Each plant-month is flagged with whether to use the RectifHyd estimate or the original EIA monthly value, based on whether the plant reports monthly (EIA preferred) or annually (RectifHyd preferred)
Reproduce RectifHyd
RectifHyd relies on a number of open and/or publicly available datasets. The steps for reproducing the dataset from scratch are detailed below. Although we would recommend starting from the input data archive.
- Clone this repo to get all scripts.
- Download the input data as a bundle for simplicity or alternatively download each of the following datasets and place them in the
datadirectory:- ResOpsUS [2]
- EIA-923 [3] (all spreadsheets 2001 - 2024)
- HILARRI v3 [4]
- Existing Hydropower Assets (EHA) 2023 [5]
- Install R dependencies using renv:
install.packages("renv") renv::restore()
- Run the following R scripts in the main directory to re-create this dataset:
1a_process_eia_spreadsheets.R– Process EIA-923 data releases (2001-2024), extract hydropower net generation, output clean data as .csv1b_download_gauge_flow.R– Download daily streamflow and reservoir release data from multiple sources (USGS, CDEC, RISE, CDSS, PNH, MBH, NWD, ResOpsUS). Flow data is cached locally.2a_disaggregate_using_release.R– Compute monthly fractions using reservoir releases from ResOpsUS and gauge-based turbine/total outflow data (~180 plants)2b_disaggregate_using_usgs.R– Compute monthly disaggregation fractions using HUC4 representative downstream USGS gauge flows (remaining ~1,300 plants)3_combine_and_compute_monthly_generation.R– Combine release-based and HUC4-based disaggregation fractions, perform disaggregation of annual to monthly generation, apply QA/QC smoothing and scaling4_create_final_file.R– Merge disaggregated generation with EIA metadata, apply recommendation logic, produce the final versioned RectifHyd CSV
Required input data
The following external datasets must be downloaded and placed in the data/ directory before running the pipeline:
- EIA-923 (2001-2024)
- Annual and monthly generation data from EIA Form 923 (and earlier Form 906/920). Download all annual zip files and extract into subdirectories.
- Location:
data/EIA-923/ - Download: EIA-923
- ResOpsUS (v2.0)
- Observed reservoir operations (storage, inflow, outflow) for ~700 US reservoirs. Used as a proxy for reservoir release.
- Location:
data/ResOpsUS/time_series_all/ - Download: Zenodo
- HILARRI (v3)
- Hydropower Infrastructure - LAkes, Reservoirs, and Rivers database. Provides the mapping between EHA plant IDs and GRanD reservoir IDs, plus HUC codes.
- Location:
data/HILARRI_v3.csv - Download: HydroSource
- EHA (FY2024)
- Existing Hydropower Assets database from ORNL. Provides plant metadata including nameplate capacity, operating mode (Run-of-River vs Storage), state, and HUC codes.
- Location:
data/ORNL_EHAHydroPlant_PublicFY2024.xlsx - Download: HydroSource
Additionally, the following files are included in the repository under data/gauge-inputs/:
flow_to_EIA_crosswalk.csv– Maps each EIA plant ID to its preferred streamflow gauge station(s) and data source(s). This crosswalk was manually curated.USGS_00060_HUC4.csv– Maps HUC4 watershed codes to representative USGS stream gauges.
Data downloaded at runtime
The following data is downloaded automatically by scripts 1b and 2b (and cached locally for subsequent runs):
- USGS NWIS – Daily mean discharge at ~250 stream gauges (
dataRetrievalR package) - California CDEC – Daily reservoir release/flow for California dams (
cderR package) - Reclamation RISE – Daily flow data from Bureau of Reclamation facilities (RISE REST API)
- Colorado CDSS – Daily streamflow from Colorado’s Decision Support Systems (CDSS REST API)
- Reclamation PNH – Daily flow from Pacific Northwest Hydromet, Columbia Basin (Hydromet web service)
- Reclamation MBH – Daily flow from Missouri Basin Hydromet (Hydromet web service)
- USACE NWD – Daily flow/release from Army Corps Northwestern Division dams (NWD Dataquery web service)
R package dependencies
R dependencies are managed with renv. After cloning, run renv::restore() to install all packages at their locked versions. Key packages include:
tidyverse– Data manipulation and visualizationreadxl– Reading EIA Excel spreadsheetsdataRetrieval– USGS NWIS streamflow data retrievalcder– California CDEC data retrievalmissRanger– Random forest imputation for missing streamflow valuesstarfit– Seasonal reservoir operations (used for ResOpsUS reservoir ID lookups)janitor– Column name cleaningrenv– Reproducible R package management
History
The original RectifHyd disaggregation procedure was conceived by Nathalie Voisin and implemented by Sean Turner (now at ORNL) around 2022 at PNNL and a journal paper [1] detailing the 1.0.0 release, the methodology, validation and dataset structure was published in 2023. Since then the dataset and codebase has been updated and maintained by Cameron Bracken with additions by Daniel Broman. The versions and their features are detailed in the table below.
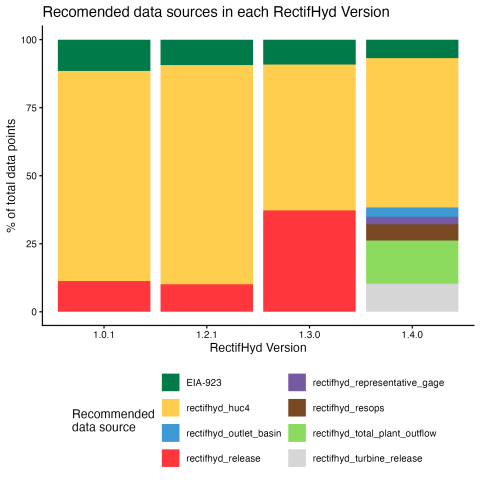
- 1.4.0 (Jan 2026) – 2001-2024. Proxies: turbine release, total outflow, representative gage data, ResOps, HUC4 gage flow. Extended to 2024, lowercase column names, code cleanup.
- 1.3.0 (Jun 2024) – 2001-2022. Proxies: turbine release, total outflow, representative gage data, ResOps, HUC4 gage flow. Expanded sources of proxy flow data and improved handling of missing and bad data.
- 1.2.1 (Oct 2023) – 2001-2022. Proxies: ResOps, HUC4 gage flow. Bug fix release.
- 1.2.0 (Oct 2023) – 2001-2022. Proxies: ResOps, HUC4 gage flow. Extended dataset to 2022.
- 1.1.0 – 2001-2020. Proxies: ResOps, HUC4 gage flow. Not publicly released.
- 1.0.1 (Aug 2022) – 2001-2020. Proxies: ResOps, HUC4 gage flow. Bug fix release.
- 1.0.0 (Jun 2022) – 2001-2020. Proxies: ResOps, HUC4 gage flow. Initial release.
Contacts
For questions about the datasets please feel free to contact us:
Version 1.1 through 1.4 - cameron.bracken@pnnl.gov, nathalie.voisin@pnnl.gov
Version 1.0, 1.0.1 - sean.turner@ornl.gov, nathalie.voisin@pnnl.gov
Related datasets and resources
Datasets produced by this project
- B1-data v1.4 – An extension of RectifHyd that adds weekly disaggregation and hydropower operational constraints (p_min, p_max, ADOR). Intended for use in grid models (PCMs/CEMs). B1-data uses RectifHyd as its primary monthly generation input.
Alternative and complementary hydropower datasets
- RectifHydPlus v1.1 – An alternative monthly hydropower generation dataset created by Sean Turner at ORNL. Covers ~593 plants with nameplate capacity >10 MW from 1980-2019 using additional data sources including DayFlow simulated streamflow, ISTARF reservoir simulation, and direct EIA spreadsheet reading. See Turner 2025.
- ORNL Existing Hydropower Assets (EHA) – Database of ~2,300 US hydropower plants with nameplate capacity, operating mode, location, and capacity factors.
- HILARRI v3 – Hydropower Infrastructure - LAkes, Reservoirs, and Rivers database linking hydropower plants to dams, reservoirs, and river reaches. Provides GRanD IDs, NHDPlus COMIDs, and HUC codes.
- ResOpsUS – Observed reservoir operations (storage, inflow, outflow) for ~700 major US reservoirs (Steyaert et al. 2021). Time series largely cover 1930-2020.
Streamflow data sources
- USGS NWIS – Daily and instantaneous streamflow at thousands of gauges nationwide. Accessed via the
dataRetrievalR package. - California CDEC – California Data Exchange Center providing reservoir and streamflow data. Accessed via the
cderR package. - Reclamation RISE – Bureau of Reclamation’s Information Sharing Environment. Provides daily flow/release data at Reclamation facilities.
- Colorado CDSS – Colorado’s Decision Support Systems providing streamflow and diversion data across the state.
- Reclamation Pacific Northwest Hydromet – Daily hydromet data for Columbia Basin facilities (Reclamation’s Pacific Northwest Region).
- Reclamation Missouri Basin Hydromet – Daily hydromet data for Missouri Basin facilities (Reclamation’s Great Plains Region).
- USACE NWD Dataquery – Army Corps of Engineers Northwestern Division near-real-time and historical data for Columbia Basin dams.
Tools and software
- Grid Hydro – PNNL’s home for hydrology and hydropower related resources, including data, code, software packages, models, reports and journal articles.
- PUDL – Public Utility Data Liberation project, providing cleaned and standardized EIA data as Parquet files.
- hydrofixr – R package for retrieving and processing USACE hydropower dam data (used in earlier B1-data versions; replaced by direct NWD API calls in v1.4).
References
- Turner, S.W.D., Voisin, N. & Nelson, K. (2022). Revised monthly energy generation estimates for 1,500 hydroelectric power plants in the United States. Scientific Data 9, 675. https://doi.org/10.1038/s41597-022-01748-x
- Bracken, C., Son, Y., Broman, D. et al. GODEEEP-hydro: Historical and projected power system ready hydropower data for the United States. Sci Data 12, 875 (2025). https://doi.org/10.1038/s41597-025-05097-3
- Turner, S.W.D. (2025). Monthly generation for 593 hydropower plants in the United States: 1980-2022. Scientific Data. https://www.nature.com/articles/s41597-025-05323-y
- Steyaert, J.C., Condon, L.E., Turner, S.W.D. & Voisin, N. (2022). ResOpsUS, a dataset of historical reservoir operations in the contiguous United States. Scientific Data 9, 34. https://doi.org/10.1038/s41597-022-01134-7
License
BSD 2-Clause License. See LICENSE for full text.
Copyright (c) 2022, Pacific Northwest National Laboratory. All rights reserved.
Citation
If you use this dataset, please cite:
Turner, S.W.D., Voisin, N. & Nelson, K. (2022). Revised monthly energy generation estimates for 1,500 hydroelectric power plants in the United States. Scientific Data 9, 675. https://doi.org/10.1038/s41597-022-01748-x
and
Bracken, C., Broman, D. & Voisin, N. (2026). RectifHyd v1.4.0: Monthly hydropower generation estimates for 1,500 hydroelectric power plants in the United States (2001-2024) .
References
[1] Turner, S.W.D., Voisin, N. & Nelson, K. Revised monthly energy generation estimates for 1,500 hydroelectric power plants in the United States. Sci Data 9, 675 (2022). https://doi.org/10.1038/s41597-022-01748-x
[2] Steyaert, J., Condon, L., Turner, S. & Voisin, N. (2021). ResOpsUS [Data set]. Zenodo. https://doi.org/10.5281/zenodo.5367383
[3] U.S. Energy Information Administration. EIA-923/906/920. [Data set]. EIA. https://www.eia.gov/electricity/data/eia923/ (all spreadsheets 2001 - 2024)
[4] Carly H. Hansen, Paul G. Matson, Bryan B. Bozeman and Sean Turner. 2024. Hydropower Infrastructure – LAkes, Reservoirs, and RIvers (HILARRI), Version 3. HydroSource. Oak Ridge National Laboratory, Oak Ridge, Tennessee, USA. DOI: 10.21951/HILARRI/2474802
[5] Megan M. Johnson, Shih-Chieh Kao and Rocio Uría-Martínez. 2024. Existing Hydropower Assets (EHA) Plant Database, 2024. HydroSource. Oak Ridge National Laboratory, Oak Ridge, Tennessee, USA. DOI: https://doi.org/10.21951/EHA_FY2024/2344934