Showing 271 - 285 of 385

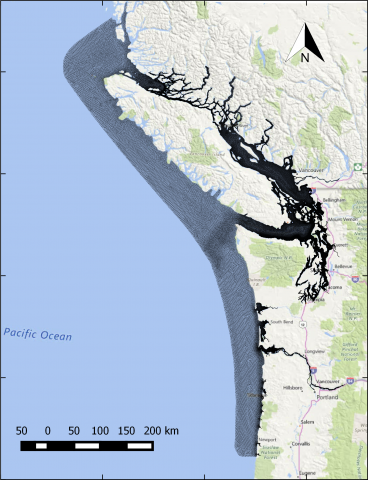
The year 2014 solution files are based on model calibration effort based on inputs and data from Year 2014 as described in Khangaonkar et al. 2018). It includes water surface elevation, currents, temperature and salinity at an hourly interval. These netcdf files with 24 hourly records include...

Please cite as : Anderson L.N., J.E. McDermott, and R.S. McClure. 2020. WA-IsoC_MSC1.1.0 (Amplicon 16S rRNA, WA). [Data Set] PNNL DataHub. https://doi.org/10.25584/WAIsoCMSC1/1635272 The soil microbiome is central to the cycling of carbon and other nutrients and to the promotion of plant growth...

Suspense at the Wildlife Preserve About the VAST Challenge The Visual Analytics Science and Technology (VAST) Challenge is an annual contest with the goal of advancing the field of visual analytics through competition. The VAST Challenge is designed to help researchers understand how their software...

The database provides high-resolution (4-km, hourly) information of mesoscale convective systems (MCSs) and isolated deep convection events (IDC) east of the Rocky Mountains over the contiguous United States from 2004 – 2017. The database contains various characteristics of MCSs and IDC, such as...

CMIP6 historical anthropogenic emissions data from 1750 - 2019 mapped to a 0.5° global grid. The format is the same as the CMIP6 data release (Hoesly et al. 2018). Data is provided in netCDF files with bulk, spectated VOC, and solid biofuel emissions, along with checksum files that provide global...

This data set provides the 16S microbial community composition via DNA sequence analysis from ingrowth peat and sand cores at the South End bog in 2013. These samples were collected outside the experimental enclosures and are pre-treatment with no experimental manipulation. These are part of the...

There is something for everyone in this year’s VAST Challenge. This year’s challenge presents three distinct mini-challenges to test your skills. These challenges are open to participation by individuals and teams in industry, government, and academia. Creative approaches to visual analytics are...

In the roughly twenty years that Tethys-based GAStech has been operating a natural gas production site in the island country of Kronos, it has produced remarkable profits and developed strong relationships with the government of Kronos. However, GAStech has not been as successful in demonstrating...

The Visual Analytics Science and Technology (VAST) Challenge is an annual contest with the goal of advancing the field of visual analytics through competition. The VAST Challenge is designed to help researchers understand how their software would be used in a novel analytic task and determine if...

Return to Kronos The Visual Analytics Science and Technology (VAST) Challenge is an annual contest with the goal of advancing the field of visual analytics through competition. The VAST Challenge is designed to help researchers understand how their software would be used in a novel analytic task and...

Mystery at the Wildlife Preserve About the VAST Challenge The Visual Analytics Science and Technology (VAST) Challenge is an annual contest with the goal of advancing the field of visual analytics through competition. The VAST Challenge is designed to help researchers understand how their software...

Please cite as : Anderson L.N., R. Wu, W.C. Nelson, J.E. McDermott, K.S. Hofmockel, and J.K. Jansson. 2021. Iso-VIG14.1.0 (Metagenome Derived Viral Genomes, WA/IA/KS). [Data Set] PNNL DataHub. https://doi.org/10.25584/IsoVIG14/1770369 Soil samples were collected in triplicate in the Fall of 2017...

Rapid remodeling of the soil lipidome in response to a drying-rewetting event - Multi-Omics Data Package DOI Data package contents reported here are the first version and contain pre- and post-processed data acquisition and subsequent downstream analysis files using various data source instrument...

Welcome to the Short-Lived Fission Product Gamma Data website! You will find experimental information as well as gamma spectra from the unseparated fission products of U-233, U-235, U-238, Np-237, and Pu-239 exposed to neutron spectra of various energies. The pdf file titled "Experimental and Data...

CMIP6 historical anthropogenic emissions data from 1980 - 2019 mapped to a 0.1° global grid. The underlying data is identical to that from the 0.5° v2021_04_21 version of this also available at this archive. The 0.5° data was downscaled to 0.1° using 0.1° proxy data from EDGAR. See: https://github...